
Quarantining in Grenada
George and I remain in quarantine on our Sailboat moored off Sandy Island, Carriacou, Grenada. We currently do not have a means to return to the United States. Travel between most of the Caribbean islands is not possible due to restrictions each island has put in place and the Grenada airport is closed.
Our situation is not dire. We are comfortable and the Grenadian government has been gracious in providing a means for us to obtain food and necessities. Should means become available to return to the United States, we will need to assess whether we would feel safe to do so.
I am a scientist, now retired – but the scientist in me still is struggling to decipher from the limited information we have, contradictory advice and predictions we receive, what I know and what I don’t know to be factual. I believe you would be wise to be certain of this as well. The information we receive is more than tainted by political beliefs, half-truths, and best guesses.
What I “know” about the extent of the disease
- Summaries of the number of infected individuals and number of deaths attributed to Covid-19 infection are posted daily at midnight GMT (8:00 EST) by country and by state. https://www.worldometers.info/coronavirus/country/us/
- These numbers can change after initial posting as actual dates of deaths for some come later.
- These numbers are subject to each state’s conventions for defining a death attributed to Covid-19. For example, in some states, all deaths of individuals testing positive for the virus are counted. In some, deaths with clinical symptoms characteristic of Covid-19 are also included. In an extreme divergence from the norm, deaths in Alabama, including those for which the individual was Covid-19 positive, are reviewed by a physician who makes a determination of the cause of death.
- The veracity of these numbers is compromised by the extent of testing and what was known about Covid-19 symptoms at the time of death.
- Determining specific cause of death is challenging with individuals known to have significant pre-existing co-morbidities and a virus that compromises the function of multiple organs and causes blood clotting
Graph 1. Number of reported deaths attributed to Covid-19 per day in the United States
These data are depicted on a logarithmic scale (on the vertical access, each incremental increase is a 10-fold increase). When an increasing trend on a logarithmic scale is linear (straight), the rate of increase is said to be logarithmic. Logarithmic, in this instance simply means the number of deaths per day (the rate of death) is steadily increasing with time.
The graph below depicts the number of deaths reported each day in the United States as reported on 29-April, 2020.
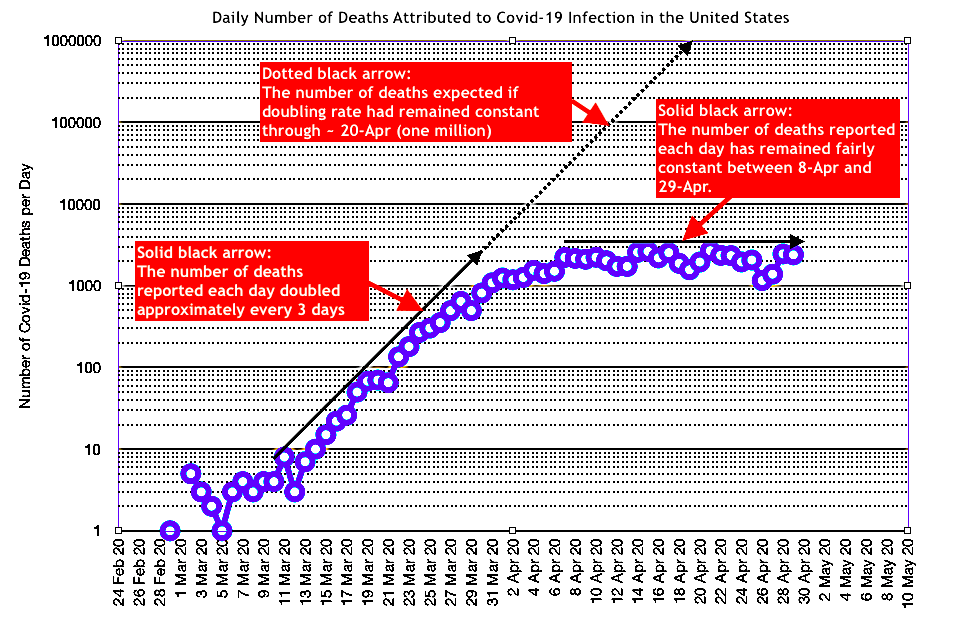 |
| Graph 1. https://www.worldometers.info/coronavirus/country/us/ (29-Apr-2020) |
What does Graph 1 show?
- Through much of March, the daily number of deaths attributed to Covid-19 was doubling approximately every 3-4 days. Had this rate been sustained, by mid-April the total number of deaths would have been approximately 1 million.
- Something changed around the end of March that slowed the daily number of reported deaths in the US attributed to Covid-19
- My Guess – large numbers of citizens or the most-susceptible citizens embraced social distancing
- From April 8th until April 29th, the daily number of reported deaths attributed to Covid-19 has oscillated between a high of 2683 per day and a low of 1156 per day with no appreciable trend up or down
Graph 2. The Cumulative number of reported deaths attributed to Covid-19 over time.
These data are cumulative, which means each days total number of deaths is added to the previous day’s total. This graph is depicted on a linear scale. References of the cumulative number of deaths over time for several other countries are provided for comparison.
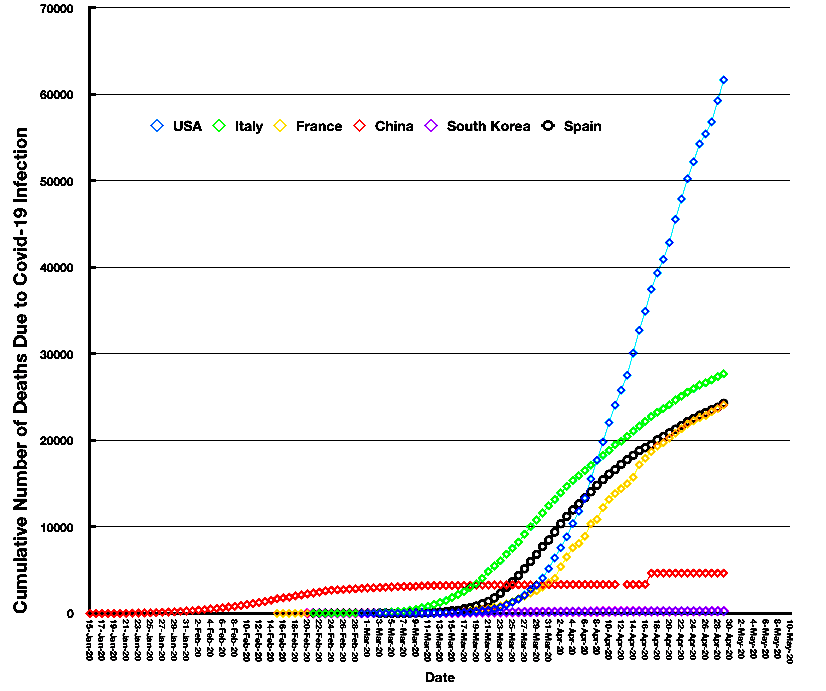 |
| Graph 2. https://www.worldometers.info/coronavirus/country/us/ (April 29, 2020) |
What does Graph 2 show?
- Despite the fact that the daily number of reported deaths attributed to Covid-19 stopped increasing around April 8th, as depicted in Graph 1, the total cumulative number of deaths has been steadily increasing, from a total of 17,691 on April 8th to over 61,655 on April 29th.
Has the number of reported infections decreased over time?
The graph below depicts the daily number of reported infections in the United States increased throughout March and began to stabilize in early April. It is very difficult to draw conclusions concerning this trend as guidelines prohibiting wide-spread testing and limitations in the ability to conduct tests is likely to have influenced the data, but it is suggestive that the number of highly symptomatic individuals (most likely to have been tested) has stabilized in the same approximate timeframe as the number of deaths have stabilized.
This should not be construed to suggest the number of infections are not increasing. For the entire month of April, the number of newly documented Covid-19 infections in the US oscillated between 25,000 and 35,000 per day.
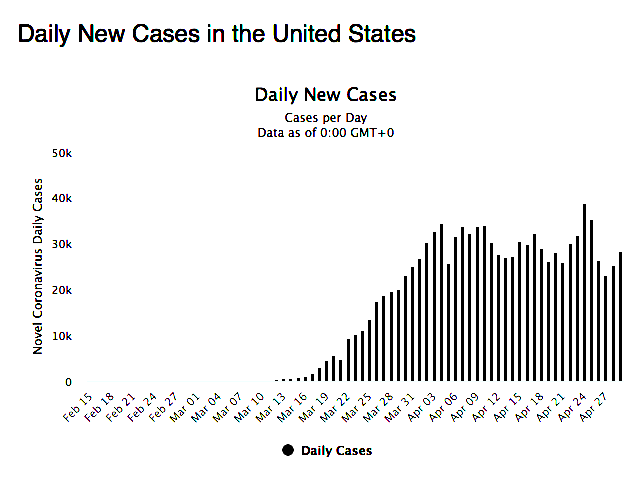 |
| https://www.worldometers.info/coronavirus/country/us/ (29-Apr-2020) |
One more thing I believe I “know”
In the early March to end of March timeline the majority of reported deaths attributed to Covid-19 came from New York State as depicted in the graph below. Throughout April, the reported number of deaths reported each day has appreciably declined.
As we know from the first graph in this opus, the daily number of reported deaths attributed to Covid-19 has not changed over the month of April. This can ONLY mean the number of reported deaths attributed to Covid-19 have increased outside of New York.
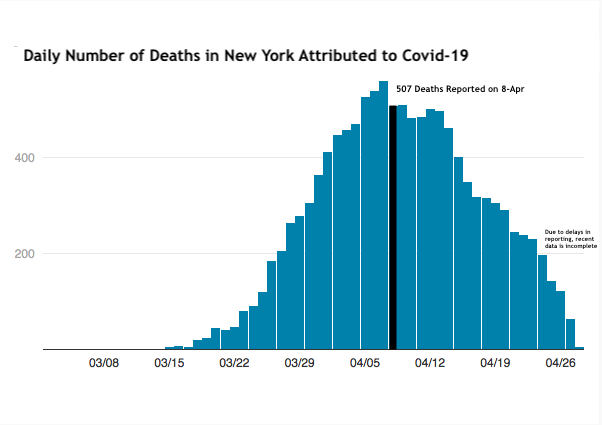 |
| https://www1.nyc.gov/site/doh/covid/covid-19-data.page (29-Apr-2020) |
Mythbuster
You hear people often say, “Covid-19 is less deadly than the flu and we don’t quarantine for that.”
The data for the total number of deaths annually due to Flu vs Covid-19
Annual Flu deaths deaths in the US – 55,672 (source https://www.cdc.gov/nchs/data/nvsr/nvsr68/nvsr68_09-508.pdf )
Covid-19 deaths, to date – 62,672 with unknown duration of the “season” (source https://www.worldometers.info/coronavirus/ ) up 1017 since I started writing this post
My Conclusions
Social distancing has very significantly curtailed the number of deaths and anyone with characteristics of the most susceptible should remain quarantined. Anyone else who can remain quarantined without due hardship should do so as we do know deaths are not only occurring in those deemed most susceptible.
Deaths are increasing steadily as of April 29th at a rate of approximately one to two thousand each day and confirmed, newly infected individuals are increasing between 25,000 and 35,000 each day.
States other than NY are increasingly driving the numbers.
Projections of just how many deaths will occur due to Covid-19 are more dependent on our own behaviors than the virus itself and I do not believe any model can predict that.
